Jason Matney, Ph.D. Résumé

Geospatial AI / Computer vision

Geospatial computer vision,
research to production.

I lead applied AI for a $70M disaster resilience program in Puerto Rico—running feature extraction and computer vision pipelines at island scale—and I’m the developer programs call when a high-priority GIS or AI prototype has to be working by the demo.

Director, Data Visualization & Analytics at ICF
Washington, DC · Open to remote

Scroll to selected work

At a glance

Clearance

Active TS, TS/SCI eligible

Doctorate

Geospatial Analytics, NC State

Experience

10+ years, research to production

Domains

Disaster resilience, defense, transportation

Selected work
at a glance

01 / Computer visionIsland-scale feature extractionPRDOH GeoFrame + RAD 02 / Rapid prototypesAsk to working systemNavy, FEMA, FMCSA 03 / Public reportingDashboards at national scaleMilitary OneSource, 988

01 / Selected work

Geospatial ML that
reached production.

Work is described at the level my public résumé already states it. No client data, source code, or federal deliverables appear on this site.

02 / The pattern

Sparse executive ask.
Working system.

When a program needs visible proof fast, I’m the one who builds it. Four of these, across four agencies, in three years—each from an unclear ask to something a decision-maker could use in a live demo.

01

U.S. Navy / Mission engagement

Find Your Care

Lead developer on a high-visibility GIS "find your care" prototype for Navy mission engagement, built largely single-handedly using Codex.

02

FEMA / Competitive pursuit

FEMADex

Led a high-priority dashboard buildout on Azure Databricks as part of a competitive effort. The work helped win the contract.

03

FMCSA / Transportation safety

Chat with your data

Built a high-visibility GIS and AI-enabled "chat with your data" prototype supporting unification of multi-state CDL license risk with illegal drivers.

04

Disaster management / Offering

Geospatial computer vision

Led computer vision work from model development through demo-ready delivery and production pipelines, and built the go-to-market geospatial computer vision offering for disaster management.

Additional rapid prototypes and live demos for DOT, DHS, the U.S. Coast Guard, the Department of War, and Navy pursuits. Described here at the level my public résumé states; no client systems, data, or code appear on this site.

03 / Public reporting

Analytics the public
can actually see.

Two federal programs where I led the analytics and the pipelines behind reporting that anyone can open today.

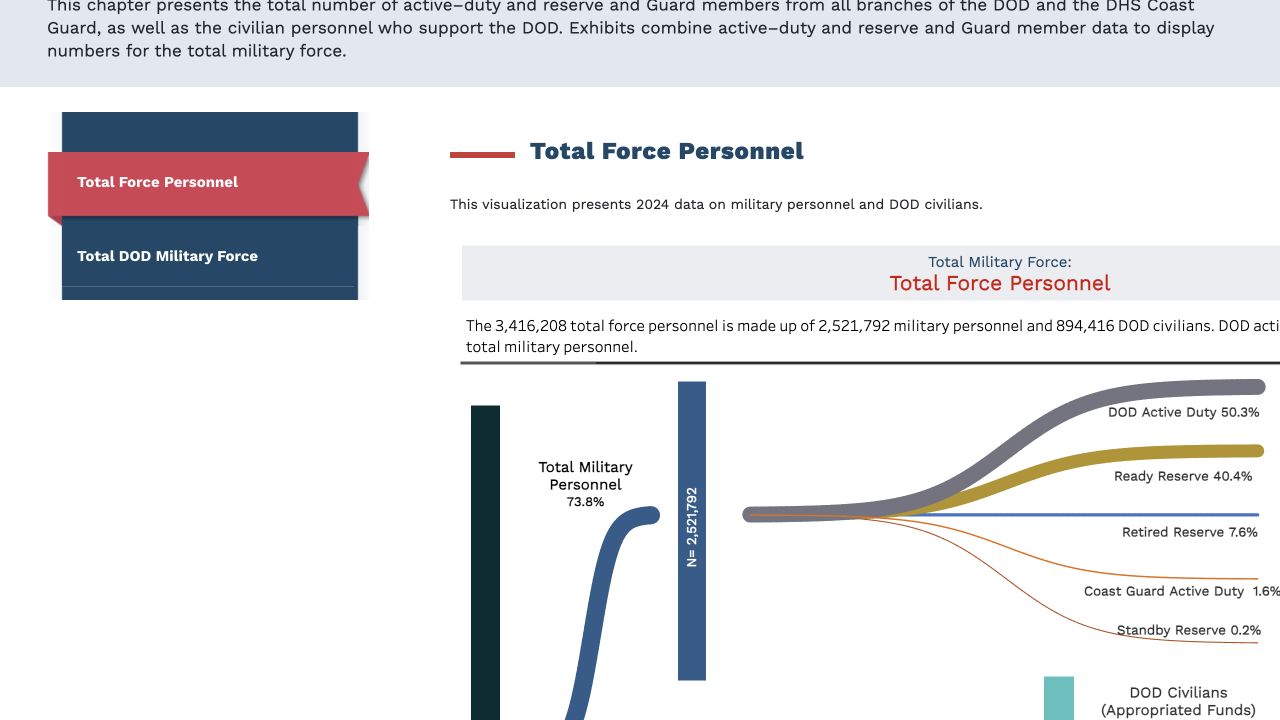
Public Military OneSource dashboard showing the 2024 Total Force Personnel visualization View the public dashboard ↗

Military OneSource · 2022 – present

Military OneSource Demographics

My role Lead, analytics and dashboards. Directed the public-facing Tableau dashboards and the Alteryx and AWS pipelines behind them, delivering demographic insight to Department leadership.

TableauAlteryxAWS

Image: public Military OneSource dashboard, captured September 2026. The public site credits ICF under contract with the Department of Defense.

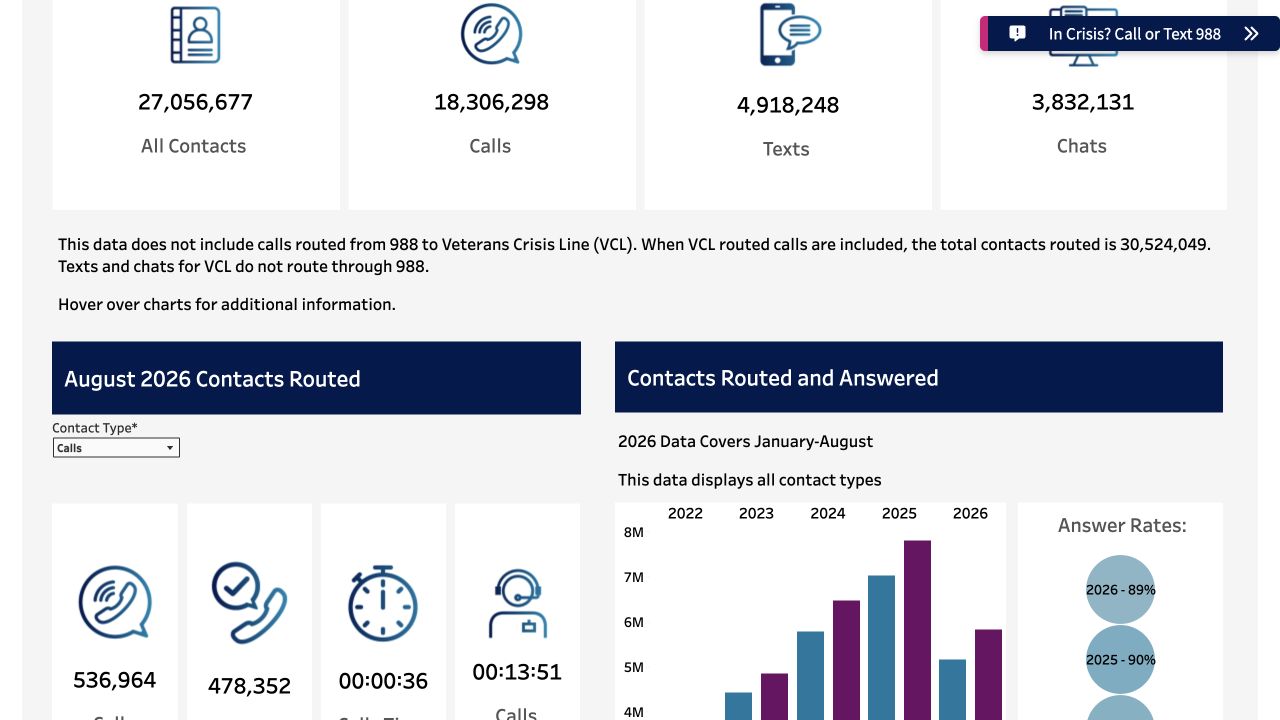
Public SAMHSA 988 Lifeline dashboard showing contact channels and performance charts View the public metrics ↗

SAMHSA · 2022 – 2025

988 Lifeline performance metrics

My role Analytics lead. Directed the public Tableau dashboard of 988 performance metrics and established the PostgreSQL data management and R ETL on AWS Lambda that kept reporting reliable at scale.

TableauPostgreSQLRAWS Lambda

Image: current public SAMHSA dashboard, captured September 2026. The dashboard may have changed since my role ended.

04 / Independent demonstration

A model that finds buildings.
And where it doesn’t.

Real model · real imagery

I fine-tuned Meta’s SAM 3.1 to find buildings in public USGS orthoimagery of Puerto Rico, using OpenStreetMap footprints from five towns as labels. It’s scored here on two towns it never saw. Footprint detection is the first layer of the kind of built-environment model a digital twin needs — this is that step, at small scale, with its errors visible. Move the threshold and watch precision trade against recall.

PUERTO RICO / USGS ORTHOIMAGERY
Found & mapped Model only Mapped, missed

Imagery: USGS The National Map orthoimagery (public domain) · Footprints © OpenStreetMap contributors (ODbL) · Independent work, no client data

Explore the output

Where does it hold up?

1. Held-out municipality
2. View
Catch moreBe surer
—Precision
—Recall
—IoU

Loading model output…

Method, data, and what this model gets wrong

Data. 1.2 km areas of Puerto Rico at 0.78 m/px, from USGS The National Map orthoimagery, which is public domain. Labels are OpenStreetMap building footprints rasterised to the same grid. San Juan, Caguas, Mayagüez, Carolina and Arecibo were used for training, and Bayamón to choose the prompt and the checkpoint. Ponce and Guaynabo weren’t touched until scoring — they’re what you see above.

Model. SAM 3.1, Meta’s open-vocabulary segmentation model, prompted with “house” — zero-shot on Bayamón it beat “roof” and “building” (0.58, 0.55 and 0.48 IoU). I froze the image backbone and text encoder and trained the detection and mask heads, about 25M of its 840M parameters, for 1,000 steps on the five training towns. The checkpoint kept is the one that did best on Bayamón. Each tile is cut into overlapping 300 m windows so the model isn’t asked to find thousands of buildings at once, and each pixel keeps the highest mask probability × confidence of any detection over it. Every number in the panel is computed in your browser from the model’s actual probability output against the held-out labels — nothing is hard-coded.

What fine-tuning bought. On the same two towns, a compact U-Net I trained from scratch scored 0.50 IoU in Ponce and 0.59 in Guaynabo. SAM 3.1 straight out of the box scored 0.54 and 0.55. Fine-tuned, it’s 0.58 and 0.62 — ahead of both in both towns, with precision and recall each up. It also fixed SAM’s confidence on overhead imagery: zero-shot its best thresholds were 0.15–0.25, and now they’re 0.40–0.45.

What it gets wrong, and why that matters. The labels are not truth, they are OpenStreetMap. Where the map is incomplete, a correct detection is scored as a false positive — so the orange areas are a mix of genuine model error and buildings nobody has mapped yet. Dense blocks of attached roofs and buildings under tree cover are the usual hard cases for footprint models, so that’s where to look. A production system would need higher-resolution imagery, multi-season capture, and human verification on the label set before any of it informed a real decision.

This is an independent demonstration built for this site. It uses no client data, no project code, and no federal deliverable.

05 / Background

From flood-risk models
to production AI.

I’m Jason Matney, Director of Data Visualization & Analytics at ICF. I set analytics and AI strategy for federal programs, lead teams of data scientists and engineers, and stay close enough to the code to be the one building when a program needs proof fast.

Before ICF, I led the GIS & Analytics team at Dewberry, applying machine learning to national flood-risk models and designing Python and PostgreSQL ETL pipelines that cut large-scale geospatial processing time by more than 40%. My doctorate is in geospatial analytics; the through-line since has been getting models out of research and into something a decision depends on.

PythonPyTorchAWSDockerPostgreSQLArcGISBIMTableau

Education

Ph.D.

Geospatial Analytics

North Carolina State University, 2019

M.S.

Geography

Michigan State University, 2014

B.A.

Program in the Environment

University of Michigan, 2009

06 / Contact

Open to roles in
geospatial AI.

Applied AI and computer vision, at geographic scale.
Washington, DC, or remote. Active TS clearance.

jamatney@gmail.com